Flood-prone
Reports. A new way to find and compare similar neighborhoods.

Display layers

Airplane noise

  • Noise levels (decibels)
    60 dB
    65 dB
    70 dB: defined as 'irritating' level of noise, comparable to a vacuum cleaner or television set at a loud volume.
    75 dB: defined as a constant irritating level of sound, comparable to a busy restaurant.
  • SOURCE: Noise Contour Map (2016) from Federal Aviation Authority.

    NOTE 1: Decibels are a logarithmic, not linear, measurement of noise levels. 70dB is twice as loud as 60dB, and 80 dB is twice as loud as 70dB. At 80dB, there is possible hearing damage over an eight hour exposure.

    NOTE 2: However, the noise contour map does not reflect all the neighborhoods that are affected by airplane noise. Please see our report for a chart of the neighborhoods where the most airplane noise complaints have been made.
  • < Return to map legend

Flood zones

  • < Return to map legend
  • Zone A
    Zone AE
    Zone AH
    Zone AO
    Zone VE
    Zone X
  • NOTE: This map is for informational purposes only and shall not supersede any federal laws or regulations applying to Flood Insurance. This map should not be used for any final flood determination and does not represent the FEMA FIRM maps. The properties displayed on this map as being within Zone A shall not imply those properties are required to purchase flood insurance; that determination is made by the National Flood Insurance Program and the official FIRMs for Suffolk County MA. This map does not necessarily identify all areas subject to flooding.

    SOURCE: Flood Hazard Areas are delineated by the Federal Emergency Management Agency (FEMA) for display on the Flood Insurance Rate Maps (FIRMS) 2016.

Zoning districts

    Flood-prone


Charlestown

Contains: Navy Yard, Sullivan Square, The Neck
65 Constellation Wharf via Redfin


East Boston

Contains: Eagle Hill, Jeffries Point, Logan Airport, Orient Heights
Image via Clippership Wharf


Fort Point

10 Farnsworth St. #PH via Redfin


Seaport District

300 Pier Four via Redfin


South Boston

Contains: Andrew Square, City Point, Dorchester Heights, Fort Hill, Seaport District
Telegraph Hill via Wikimedia Commons

Flood-prone neighborhoods

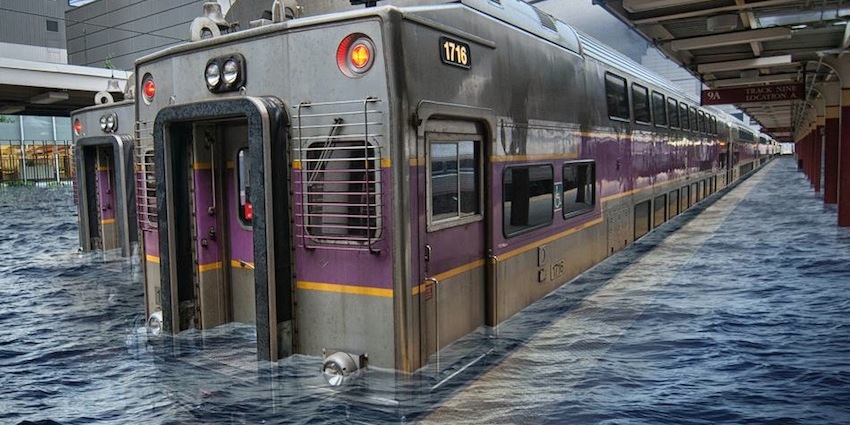
Parts of Charlestown, East Boston, and South Boston (including Fort Point and the Seaport) are already at risk of significant flooding due to storm surges. By 2030, sea levels are expected to have risen nine inches over present levels, according to Next City, and by two to three feet before the end of the century.

Many waterfront neighborhoods of Boston have been built on, or expanded using, reclaimed land. Faneuil Hall was once on the waterfront (the bricks marked with squiggles and fish indicate where the land is over the former harbor), and neighborhoods like Back Bay, Bay Village, Beacon Hill's Flat of the Hill, Chinatown, Leather District, Fenway-Kenmore, the South End, and the Waterfront were among those using reclaimed land.

This land can settle over time, and as a result can be more vulnerable to horizontal flooding from storm surges. The street flooding in the Financial District and the Seaport in the January 2018 storm was a vivid reminder that these neighborhoods are perhaps more vulnerable to rising sea levels and storm surges. In addition to the waterfront areas, the Charles River Basin is also vulnerable, according to research from Boston University. In 1996, the Muddy River overflowed and flooded the Green Line tunnels up to the ticket booth at Kenmore Square.

In addition, the increasing development density along the waterfront areas puts more people, buildings, and infrastructure at risk given that sea levels will continue to rise, and storm surges will likely become more frequent and intense.